
Covid Sentiment Analysis Using Geo Social Data
- Nagasuruthika
- Apr 29, 2021
- 3 min read
Looking to analyse people's behaviour in a particular area? Looking for leads for a particular medicine or hospital lead on Twitter? These are a few of many areas where twitter data comes in handy.
Web scraping is a really helpful tool for anyone who needs and deals with data and analysing the same for various purposes. In this article, we’d be seeing how to go about filtering tweets based on keyword and geolocation coordinates. Twitter has user-friendly APIs to easily access publicly available data.
Here’s what we would cover in this article:
Web scraping tweets.
Sentiment analysis on scraped tweets.
Web Scraping based on geolocation
Geolocation refers to the identification of the geographic location of a user or computing device via a variety of data collection mechanisms. Filtering based on geolocation tags helps us get tweets accurate to a location.
To create API’s follow the below steps:
1. Sign up for your Twitter if you don’t have an account.
2. Create New Application
3. Go to: https://dev.twitter.com/apps/new
4. Enter your Application Name, Description, and website address.
Now we have APIKey, SecretAPIkey, Access token, and secret access token save them in a text file to access them.
Here we are searching for April 2021 with the keyword “lockdown” and location Delhi and Mumbai.
We’ll be using tweepy for this project, It is an easy-to-use Python library for accessing the Twitter API. We will grab details like geo, tweet text, user name, user location.
We further parse the scraped tweets and convert them into a CSV file to further do sentiment analysis.
The CSV file would look like this:

Sentiment Analysis:
Sentiment Analysis is the process of ‘computationally’ determining whether a piece of writing is positive, negative, or neutral. It’s also known as opinion mining, deriving the opinion or attitude of a speaker.
We’ll be using the following libraries:
Textblob is the python library for processing textual data.
Natural Language Processing with Python NLTK is one of the leading platforms for working with human language data
Pandas is a fast, powerful, flexible, and easy to use open-source data analysis and manipulation tool, built on top of the Python programming language
Matplotlib is a comprehensive library for creating static, animated, and interactive visualizations in Python
Data pre-processing
The first step to sentiment analysis would be Data pre-processing, Data preprocessing is a data mining technique that is used to transform the raw data in a useful and efficient format.
Also here we would use the NLTK library to perform lemmatization and stemming on the tweets.
Stemming and Lemmatization both generate the root form of the inflected words. The difference is that stem might not be an actual word whereas, the lemma is an actual language word.
We clean the data further by removing RT and punctuations and the output would look like this:

We’d use visualisation techniques like word cloud and matplotlib to further get Data insights.
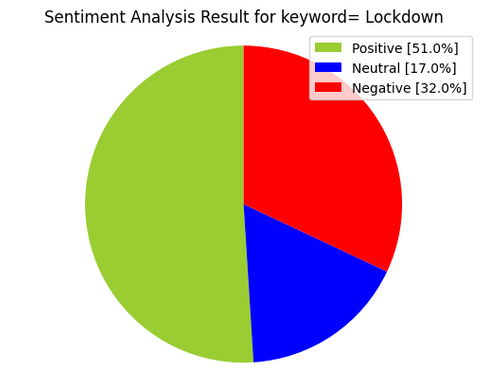
Following pictures are visualisation techniques for lockdown based on tweets from 15-04-2021 in Delhi and Mumbai obtained real-time using the geotags:
Sentiment Analysis - Delhi and Mumbai


Wordcloud - Delhi

Wordcloud - Mumbai

Positive Wordcloud - Delhi

Positive Wordcloud - Mumbai

Negative Wordcloud - Delhi

Negative Wordcloud - Mumbai
Further, we’d use a text blob library to find the polarity and subjectivity of the tweets.
The sentiment property returns Sentiment(polarity, subjectivity). The polarity score is a float within the range [-1.0, 1.0]. The subjectivity is a float within the range [0.0, 1.0] where 0.0 is very objective and 1.0 is very subjective.
TextBlob calculates subjectivity by looking at the ‘intensity’. Intensity determines if a word modifies the next word. For English, adverbs are used as modifiers (‘very good’).
The results are obtained as follows:

In this article, we've covered scraping tweets, what Sentiment Analysis is after which did visualisations for lockdown based on tweets from 15-04-2021 in Delhi and Mumbai obtained real-time using the geotags.
For any suggestions, you can always reach out to me on LinkedIn :


Comments